Proton diffusion plays a central role in many processes ranging from the regulation of biological functions to the production of electricity in fuel cells. The renewed emphasis on developing the next generation of portable sources of power requires the development of lightweight pro-tonic conducting materials for use as electrolytic membranes (Refer to reference 1). Furthermore, understanding the atomic-scale mechanism of pro-tonic diffusion in candidate materials is necessary to optimize their performance. Since neutrons are particularly sensitive to hydrogen, neutron scattering is an extremely valuable probe of proton dynamics (including diffusion). Moreover, because the wavelength of neutrons is comparable to inter-atomic distances, neutron scattering is capable of revealing the atomic-scale geometry of pro-tonic motions in a way that is unmatched by other spectroscopic probes. Computational techniques also provide detailed atomistic information about proton incorporation and dynamics. Because of the simplicity of the scattering mechanism, computational results can be directly compared to neutron scattering data. Thus neutron scattering and computational methods are a powerful combination for understanding the performance of pro-tonic conducting materials (Refer to reference 2). Here we briefly describe neutron vibrational spectroscopy (N V S) and quasielastic neutron scattering (Q N S) measurements on superpro-tonic conductors of the general formula M hydrogen, X oxygen, sub 4, (with M equal to rubidium or cesium, and X equal to sulfur, selenium, etcetera) that reveal detailed information on the proton-conduction mechanism.
The crystal structure of alkali-metal hydrogen sulfates and selenates consists of chains of X oxygen, sub 4 tetrahedra (Figure 1), which are linked by hydrogen bonds, O - H, · · O.. Due to the proximity of the proton site to the midpoint of the O - O, separation, it is believed that the proton is dynamically disordered, yielding symmetric hydrogen bonds. However, at a sufficiently low temperature, one expects that the protons may order, giving rise to observable changes in the vibrational spectrum. Above room temperature, there is an orientational order-disorder transition to a phase in which the tetrahedra are dynamically disordered and which displays a very large pro-tonic conductivity that should be observable by Q N S.
| Figure 1. Projection of the M hydrogen X oxygen sub 4 structure, showing the zigzag pattern of the hydrogen bonds between X oxygen sub 4 tetrahedra. Yellow dashed lines indicate the hydrogen bonds. |
Figure 2 summarizes N V S results on rubidium hydrogen sulfate measured using the Filter Analyzer Neutron Spectrometer. At low temperatures, the N V S spectrum shows sharp peaks at 83.3 milli electron volts and 99.7 milli electron volts. The temperature dependence of these peaks is quite unusual. The intensities decrease very rapidly with increasing temperature and almost disappear at temperatures as low as 200 K. In addition, while the high-energy mode softens, as expected, the low-energy mode hardens by about 2 milli electron volts as the temperature is increased. Near 200 K, these two modes collapse to form a broad feature around 95 milli electron volts. This suggests that there is significant proton motion even at this low temperature. We believe that this unusual behavior is related to dynamically disordered hydrogen bonds arising from breaking and reforming O - H bonds. Careful neutron diffraction studies in deuterated materials are underway to look for significant changes in the apparent locations or thermal factors of the protons at these temperatures. It should be noted that since this type of dynamical disorder is localized to two neighboring oxygen ions, it cannot be responsible for long-range pro-tonic conduction.
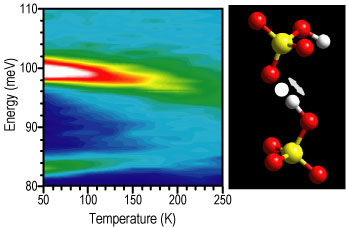
| Figure 2. Temperature-dependent N V S measurements of rubidium hydrogen sulfate. As discussed above, these results suggest very large amplitude proton motions are present at temperatures as low as approximately 100 K. The right panel illustrates the dynamically disordered hydrogen bonding, which is most likely responsible for this unusual temperature dependence. |
To probe pro-tonic diffusion directly, the temperature dependence of the Q N S was measured for cesium hydrogen sulfate sub one minus x, selenate sub x, with x approximately equal to 0.24 above room temperature using the Fermi-Chopper time-of-flight Spectrometer. The data were fit as a function of the scattering vector Q (assuming both elastic and quasielastic components) in order to extract the Elastic Incoherent Structure Factor (E I S F), which is defined as the fraction of the total scattering that is elastic. Figure 3 shows the E I S F as a function of Q for several different temperatures. The fact that a non-zero E I S F is observed even at 475 K indicates that, within the time window of the measurement (< 20 p s), the hydrogen motion is localized rather than diffusive. Moreover, the fact that the E I S F changes with temperature indicates the existence of non-energetically equivalent proton-sites. The best fit to the E I S F (shown by the solid lines in Figure 3) was obtained assuming two types of hopping motions for the protons between pairs of inequivalent sites. The agreement between the data and the model is excellent. The two jump distances, 1.4 angstroms and 4.5 angstroms, are essentially independent of temperature (see Figure 4). Looking at the structure, these can easily be identified as the reorientation of the S, O, sub 4, - H, group around the quasi-threefold (1.4 angstroms), and the quasi-twofold (4.5 angstroms), axes (Figure 4). The ratio of the times that the proton spends in each of the two sites depends exponentially on temperature as expected (solid lines in the upper left panel of Figure 4). For the short-distance reorientation, the time ratio goes rapidly to unity around 405 K, just before the superprotonic phase transition, indicating that the two sites are equally populated. For the long-distance reorientation, the ratio approaches 0.2 at the highest temperature.
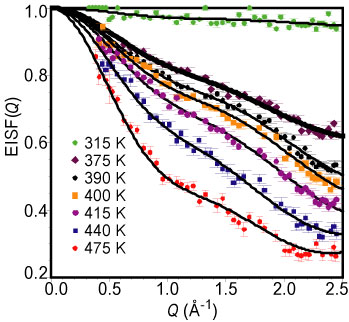
| Figure 3. E I S F (dots) and fits (solid lines) at different temperatures for cesium hydrogen sulfate sub one minus x, selenate sub x, with x approximately equal to 0.24 |
These findings are consistent with a previous neutron- powder-diffraction study on the high-temperature phase of cesium hydrogen sulfate, which revealed four different orientations of each tetra hedron (Refer to reference 3). Most probably the four orientations mimic the dynamical orientational disorder of the tetrahedra that we observe by Q N S. We also note that the two types of dynamic orientational disorder shown in Figure 4 do not result in long-range pro-tonic conduction since the motions are localized on a single tetra hedron. However, when one combines these two motions with the dynamically disordered hydrogen bond implied by N V S, the mechanism of pro-tonic conduction can be understood. Namely, the protons move between two neighboring tetrahedra via dynamically disordered hydrogen bonds. The tetrahedra then reorient, allowing the protons to move to a third tetra hedron, again via the dynamically disordered hydrogen bonds. Thus the tetrahedra play the role of a “bucket brigade” by accepting a proton from an adjacent tetra hedron then turning and handing it the tetra hedron on the other side. On the atomic scale, superprotonic conductivity occurs in the M hydrogen X oxygen sub 4 family of compounds due to this efficient mechanism of transporting protons through the lattice.
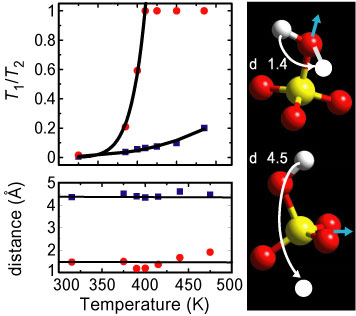
| Bottom: The two jump distances obtained from Q N S as a function of temperature. These distances correspond to the two reorientational motions shown on the right. The red circles correspond to the motion depicted on top while the blue squares correspond to the motion shown on the bottom. |
References
[1] National Hydrogen Energy Roadmap, DOE, Germantown, MD, 2002.
[2] T. Yildirim, B. Reisner, T. J. Udovic, and D. A. Neumann, Sol. State Ionics 145, 429 (2001).
[3] A. V. Belushkin, C. J. Carlile, W. I. F. David, I. R. Ibberson, L. A. Shuvalov, W. Zajac, Physica B174, 268 (1991).
Authors
T. Yildirim, D. A. Neumann, and T. J. Udovic
NIST Center for Neutron Research
National Institute of Standards and Technology
Gaithersburg, MD 20899-8562
Back to FY2002 HTML main page
Go to next article
To view all symbols correctly, please download Internet Explorer 6 or Netscape 7.1