
|

|
|
| Home | Live Data | Instruments | CHRNS | Proposals |
GSAS Nickel example using EXPGUI (part 6)
6. Plot data using POWPLOT or LIVEPLOT
At this point in the GSAS tutorial program POWPLOT is used to plot the diffraction data. This is done in EXPGUI by pressing POWPLOT button in the button bar, or by pressing the POWPLOT menu item in either the Powder menu or the Graphs menu. The input supplied to POWPLOT and the results are the same as what is shown in the menu, so this will not be repeated here.EXPGUI does offer another way to display diffraction data, LIVEPLOT. Similar to the way POWPREF was run in the previous step, LIVEPLOT can be started by pressing LIVEPLOT button in the button bar, or by pressing the LIVEPLOT menu item in the Graphs menu.
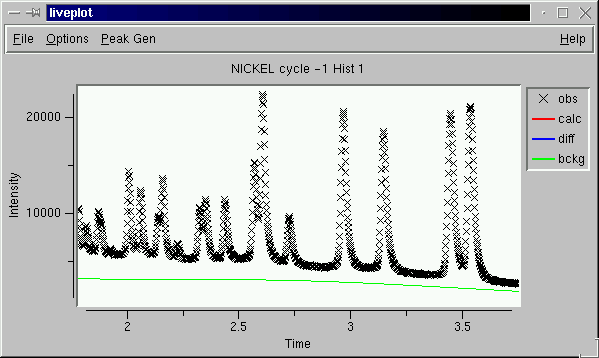
Since no cycles of refinement have been run, after LIVEPLOT has generated a blank window, it must be triggered to read the POWPREF output by pressing the "Update Plot" item in the File menu. A plot similar to the one to the left is then displayed.
The contents of the LIVEPLOT window are discussed more fully below, but note that the calculated diffraction intensities are all zero at this point, since GENLES has not yet been to run to simulate the pattern. Likewise the background values have not yet been fit so this curve is a poor fit. The blue line shows the values of obs-calc (diff), offset negatively. The sum of the fixed background values plus the fitted background function is shown difference pattern is
Note that the region plotted can be changed by clicking with the left mouse button, to outline the region to be shown, as seen to the left. When the left mouse button is pressed a second time, the graph is "zoomed in," as is shown below. To "zoom out" to the previous region, press the right mouse button.
Reflection positions can be marked, using the File/Tickmarks menu.
Reflection indices can be displayed by pressing the "h" (or "H") key in the position of the reflection to be labeled. The size and time before the reflection labels are removed is determined by values in the Options/HKL labeling menu.
Do not exit LIVEPLOT at this time as it will be used again in part 8 of this tutorial.
LIVEPLOT Contents and Options
Note that the observed data points (obs) are marked with "x" symbols in LIVEPLOT. This can be changed in the Options/Obs symbol menu. The simulated diffraction data based on the crystallographic model (calc) is shown as a red line. The lower blue line shows the values of obs-calc (diff), offset negatively to avoid overlapping with the previous curves. The green line (mostly obscured in this figure) shows the background function (bckg). This is the sum of the fixed background values (if any) plus the fitted background function (if used). The dashed magenta vertical lines denote reflection positions. The color and lengths of these lines can be customized using the options/Configure Tickmarks menu item, for example, auto placement mode creates the more customary short tickmarks placed below the pattern, at different heights when more than one phase is present.There are many other options available in LIVEPLOT in the Options menu. The Appearance and location of the tickmarks can be set. The symbol and symbol size used for observed data can be selected. The X and Y units can be changed to Q or d-space values. Background can be subtracted. The legend can be removed from the plot.
Previous step: Run POWPREF
Next step: Setup for Least-Squares Refinement
Comments, corrections or questions: crystal@NIST.gov
Last modified 02-August-2007 by website owner: NCNR (attn: Craig Brown)
$Revision: 1.4 $ $Date: 2002/04/12 21:21:18 $