GSAS Nickel example using EXPGUI (part 3)
3. Add data (histograms) to the Experiment
The next step in the tutorial is to add data. Note that
GSAS uses the term
histogram to refer to a powder diffraction data set.
To add data, switch to the Histogram in EXPGUI pane and press the
"Add New Histogram" button in the lower right.
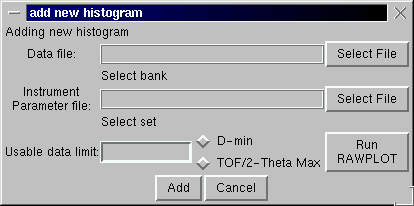 This brings up the "add new histogram" dialog, to the left.
Press on the upper "Select File" button for a dialog box to select
a data file.
This brings up the "add new histogram" dialog, to the left.
Press on the upper "Select File" button for a dialog box to select
a data file.
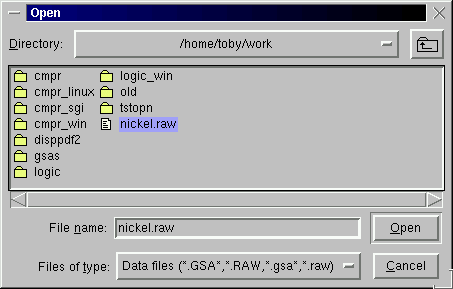 Select the appropriate file, in this case nickel.raw and press
the "Open" button.
At this stage, different things can happen.
If the file is not correctly formatted,
a dialog will offer
to convert the file to the correct format.
Also, in some cases, the data file specifies the name of the instrument
parameter file. If so, that name will be loaded into the "Instrument
Parameter file" box. If not, as in this case, the file must be selected
by pressing the lower "Select File" button which creates a
dialog box to select an instrument parameter file, similar
to the one above.
Select the appropriate file, in this case nickel.raw and press
the "Open" button.
At this stage, different things can happen.
If the file is not correctly formatted,
a dialog will offer
to convert the file to the correct format.
Also, in some cases, the data file specifies the name of the instrument
parameter file. If so, that name will be loaded into the "Instrument
Parameter file" box. If not, as in this case, the file must be selected
by pressing the lower "Select File" button which creates a
dialog box to select an instrument parameter file, similar
to the one above.
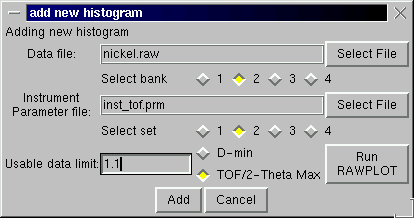 After the appropriate instrument parameter file is located and selected,
one must select the bank of data (if more than one) and the bank of the
instrument parameters (if more than one) using the bank checkbuttons.
Finally one must enter either the minimum d-space or
maximum time-of-flight or two-theta to be used from the data (note that
this value can be changed later if need be from EXPEDT). A
good way to do this is to use
RAWPLOT
to look at the data. This is done
by pressing the "Run RAWPLOT" button at the
lower right (example).
This invokes the GSAS RAWPLOT program. Note that you will need to specify the
same data and instrument parameters file names to RAWPLOT to see a
plot of the data.
When all input is complete, press Add to run program EXPTOOL and read the
data into the .EXP file.
After the appropriate instrument parameter file is located and selected,
one must select the bank of data (if more than one) and the bank of the
instrument parameters (if more than one) using the bank checkbuttons.
Finally one must enter either the minimum d-space or
maximum time-of-flight or two-theta to be used from the data (note that
this value can be changed later if need be from EXPEDT). A
good way to do this is to use
RAWPLOT
to look at the data. This is done
by pressing the "Run RAWPLOT" button at the
lower right (example).
This invokes the GSAS RAWPLOT program. Note that you will need to specify the
same data and instrument parameters file names to RAWPLOT to see a
plot of the data.
When all input is complete, press Add to run program EXPTOOL and read the
data into the .EXP file.
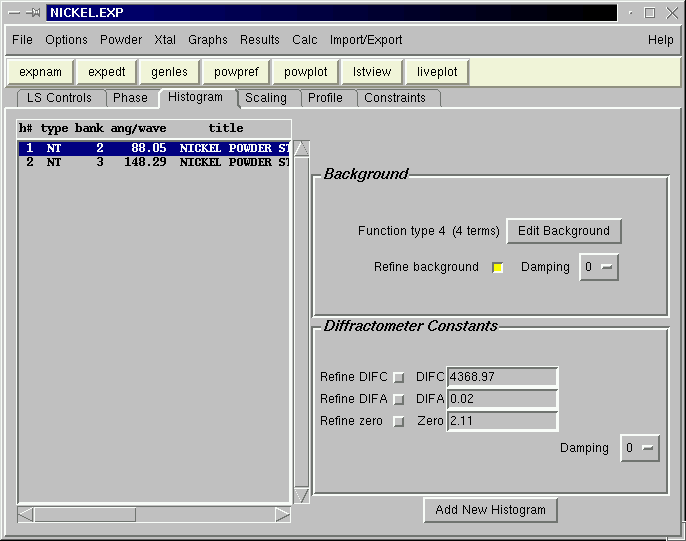
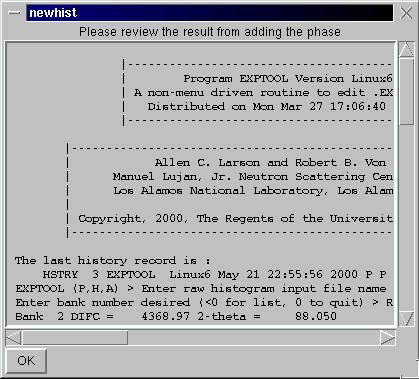 The results from the EXPTOOL are shown in a separate box, so
that errors can be noted.
The results from the EXPTOOL are shown in a separate box, so
that errors can be noted.
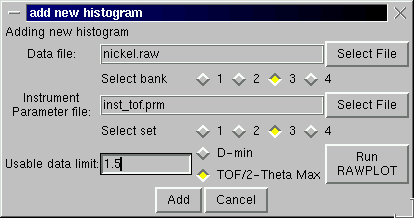 The above procedure is then repeated for the third bank of data, but this
time the maximum time-of-flight is changed to 1.5.
The above procedure is then repeated for the third bank of data, but this
time the maximum time-of-flight is changed to 1.5.
After Add is pressed, the EXPTOOL results are
displayed and then the histogram panel is
updated so that the diffraction parameters
for each of the two histograms can be examined
(see below).
There is one deviation in the above
compared to the tutorial in the GSAS manual.
In that tutorial the
data compression factor is set to 2 for the
first histogram, averaging pairs
of points to speed up
the computations. This cannot be done from EXPGUI.
If desired, it can be done using EXPEDT, but for
most modern computers this tutorial will still run
in seconds with no compression.
(.EXP Snapshot:
nickel3.exp
)
Previous step:
Add a phase to the Experiment
Next step:
Change a profile parameter