
|

|
|
| Home | Live Data | Instruments | CHRNS | Proposals |
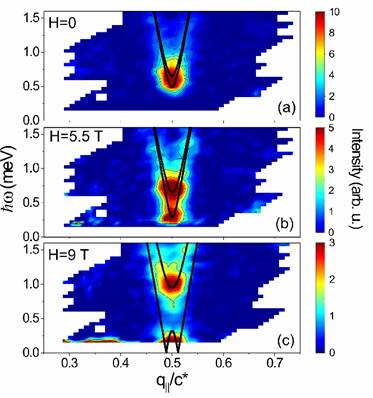
Figure 1 False color plots of inelastic intensity measured in NDMAP at T=2.5 K for different values of magnetic field applied along the b- axis. The extra intensity seen below q||=0.4 c* at low energies in (c) is an artifact of imperfect background subtraction. Solid lines indicate expectations from a free fermion model.
Last modified 04-February-2002 by website owner: NCNR (attn: Jeff Krzywon)