Python programs
These programs assume that you have a functional python environment on your computer.
These programs are installed on the BT-1 instrument computer (you only
need to type 'readtemp', 'readtemp-1file xxxxx001.bt1' or 'BT1-plot xxxxx001.bt1'.)
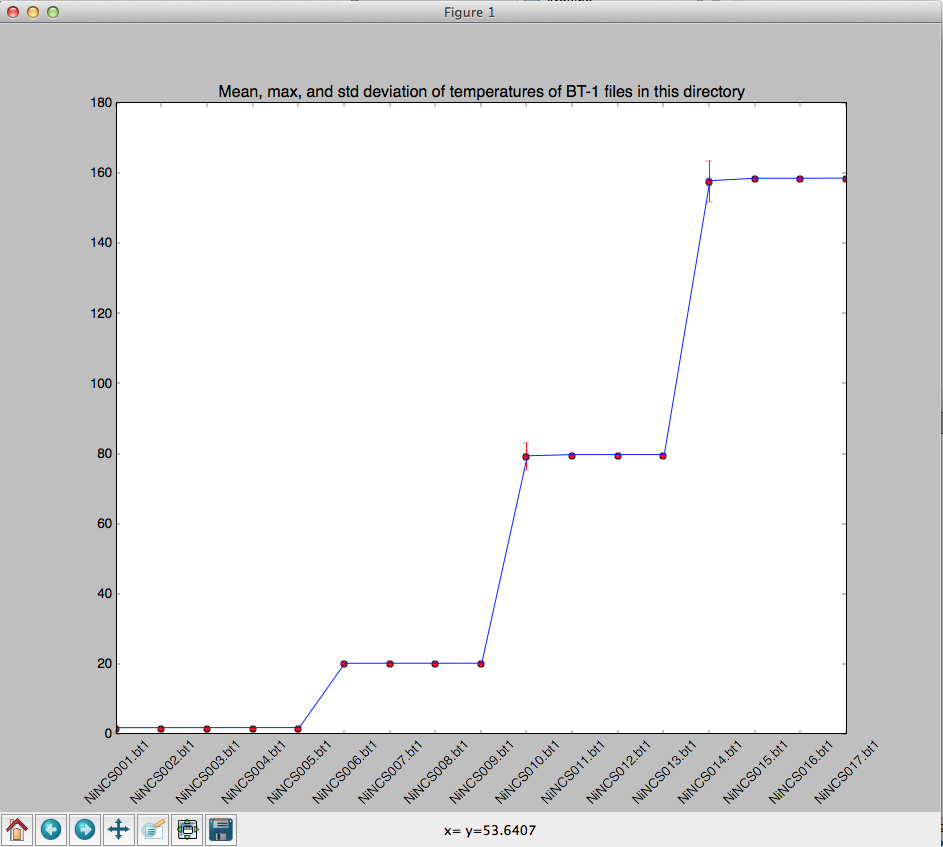
Plot the average temperature of all data points in a file, for all files in a directory
DOWNLOAD
This python program will read the temperatures of each data point collected in each
BT-1 data file in the directory it is run from.
The data is plotted for the mean T, a blue error bar for the std dev.
and a red error bar that indicates wether the maximum deviation from the mean
for each file listed horizontally. This is useful to quickly check for thermal
equilibrium throughout data collection in one convenient plot.
Usage: python readtemp.py
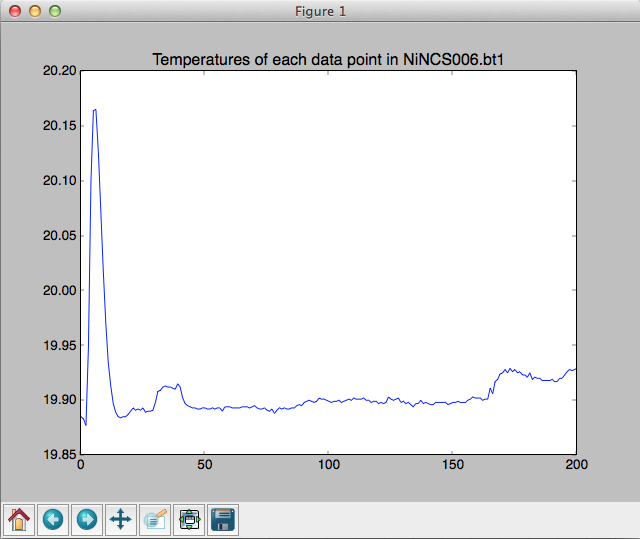
Plot the temperature at each data point in a file
DOWNLOAD
This python program will read the temperatures of each data point collected in a given
BT-1 data file.
The data is plotted for each detector position.
This is useful to check in more detail about the thermal
history throughout data collection in one convenient plot.
Usage: python readtemp-1file.py xxxxx001.bt1
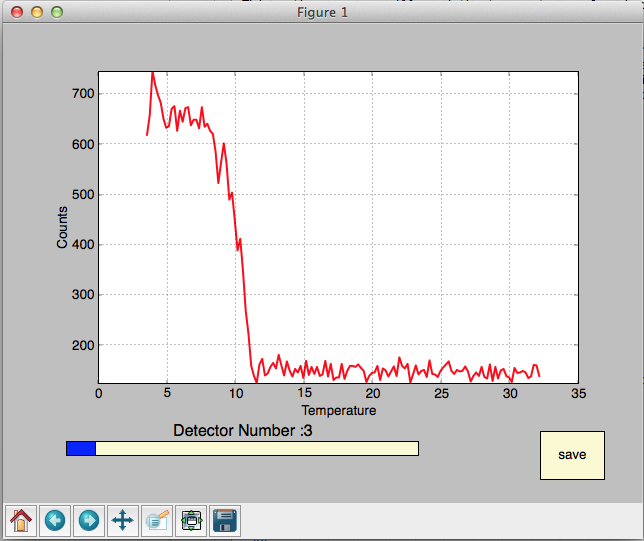
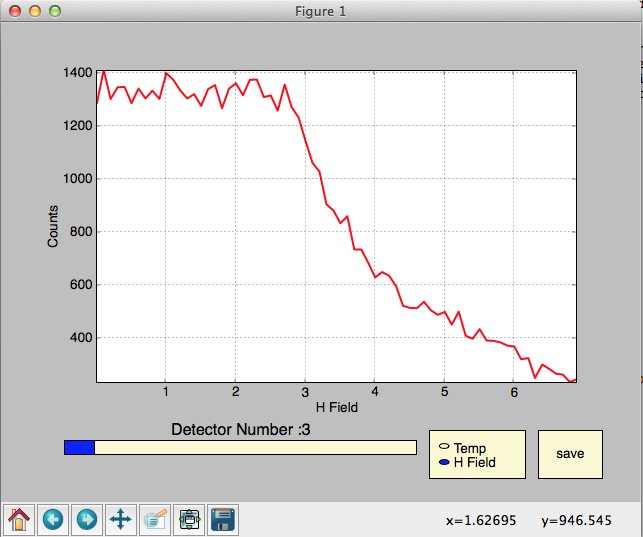
Plot the temperature or H-field at a fixed angle
DOWNLOAD
This python program will plot the temperature or (if available) the
H-filed dependence of each data point in a BT-1 file.
It is appropriate ONLY for those times when sitting on
a particular Bragg peak and scanning T or H.
The chosen detector (via the slider) dependence against T or H (if a BH1 file is
available) is plotted. Data can be saved as det#.dat with the 'save' button.
Usage: python BT1-plot.py xxxxx001.bt1
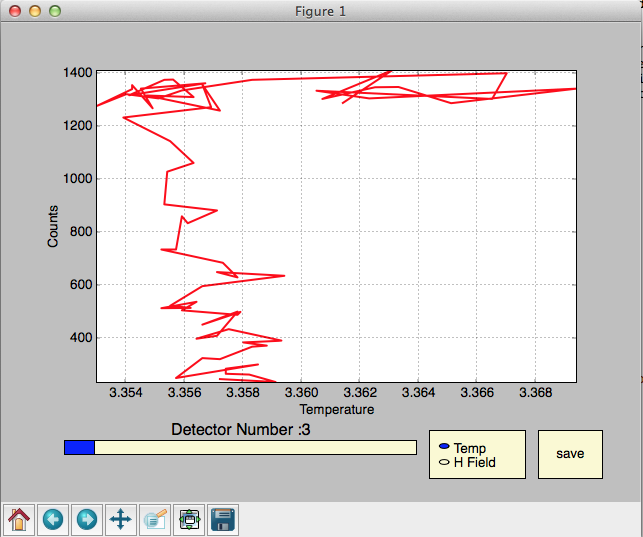
Warning - If there is random lines on the plot- you do not have the right type of
measurement to make this plotting program useful e.g.:
Issues with these? Contact:
Address:
100 Bureau Drive, Stop 6102
National Institute of Standards and Technology
Gaithersburg, MD 20878
|