The multi-billion dollar electronic and optical device industry is always searching for inexpensive and adaptable materials for use in a wide variety of applications such as display screens for communications, entertainment and computers. Semiconducting organic molecules are currently under intense investigation in this regard as it is possible to precisely tune their properties through synthetic modification and to easily control self-assembly. However, for the full promise of organic semiconductors to be realized, a thorough understanding of the physical properties that control electronic charge transport and photonic behavior is required.
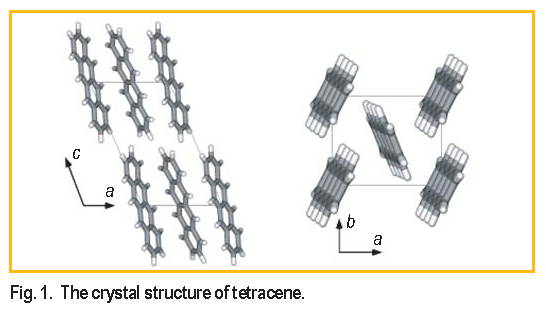
Tetracene, an aromatic molecule consisting of
4 fused benzene rings, adopts a layered, herringbone
structure in the solid state ( Figure 1 ). When a layer of
tetracene is incorporated as the functional component of a
field effect transistor, the edge-on-face molecular orientation
within the ab-plane of the crystal evidently provides
sufficient  electron cloud overlap between adjacent
molecules to enable conduction of charge carriers. Conduction
measurements have been performed on tetracene
as a function of pressure between ambient and 620 M P a at
room temperature [ 1 ]. The results indicate a linear
increase in conductance between ambient pressure up to
electron cloud overlap between adjacent
molecules to enable conduction of charge carriers. Conduction
measurements have been performed on tetracene
as a function of pressure between ambient and 620 M P a at
room temperature [ 1 ]. The results indicate a linear
increase in conductance between ambient pressure up to
 300 M P a and a sharp quenching of conduction as the
pressure is increased above 300 M P a. In order to ascertain
the physical underpinnings of this observation ( which
yield insight into the conduction mechanism ), neutron
powder diffraction and inelastic neutron scattering measurement
techniques have been employed to characterize
the pressure-dependent structural and vibrational behavior
of tetracene up to approximately 360 M P a at 298 K.
300 M P a and a sharp quenching of conduction as the
pressure is increased above 300 M P a. In order to ascertain
the physical underpinnings of this observation ( which
yield insight into the conduction mechanism ), neutron
powder diffraction and inelastic neutron scattering measurement
techniques have been employed to characterize
the pressure-dependent structural and vibrational behavior
of tetracene up to approximately 360 M P a at 298 K.
The diffraction data were collected at NCNR’s High
Resolution Neutron Powder Diffractometer at BT-1 using
the Cu ( 311 ) monochromator and neutron wavelength of
1.54  . The six unit-cell parameters were extracted by
fitting the powder diffraction patterns using the graphical
user interface E X P G U I to the General Structure Analysis
System ( G S A S ) program assuming the known solid
tetracene structure [ 2, 3 ].
. The six unit-cell parameters were extracted by
fitting the powder diffraction patterns using the graphical
user interface E X P G U I to the General Structure Analysis
System ( G S A S ) program assuming the known solid
tetracene structure [ 2, 3 ].
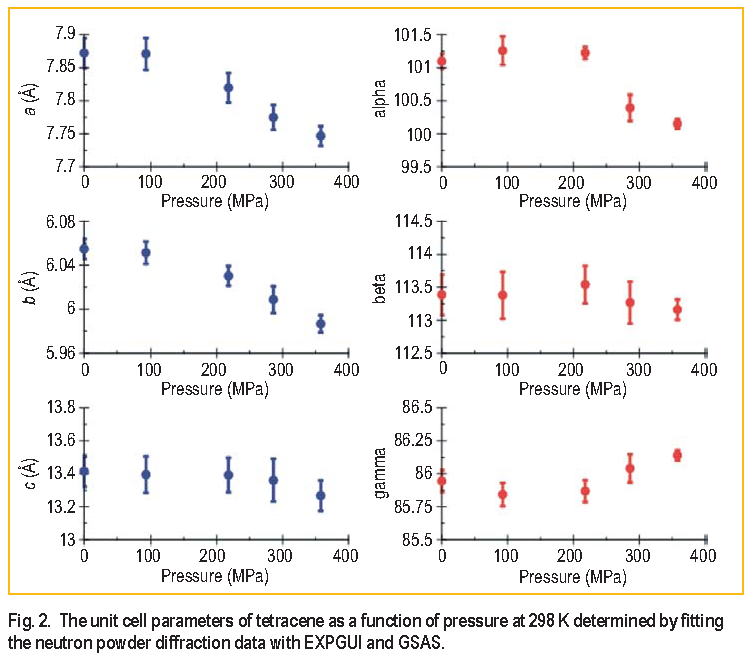
These unit cell parameters are shown as a function of
pressure in Figure 2. As the pressure is increased, each side
of the unit cell contracts, resulting in a material with a
higher electron density. It is likely that the increase in
electron density accounts for the observed increase in
conduction in tetracene at pressures up to 300 M P a.
However, apparent from the unit cell angle parameters
alpha and gamma is a modification of the crystalline
structure between 210 M P a and 280 M P a. The change in
trend of the unit cell angle parameter is likely due to a
strain-induced phase transition that is believed to result in
the relative rotation of adjacent tetracene molecules within
the herringbone layer [ 4 ]. It is thought that this structural
modification is of sufficient magnitude to disrupt the
continuous electron cloud overlap in the low-pressure
phase of tetracene to the extent that it is no longer able to
conduct charge carriers.
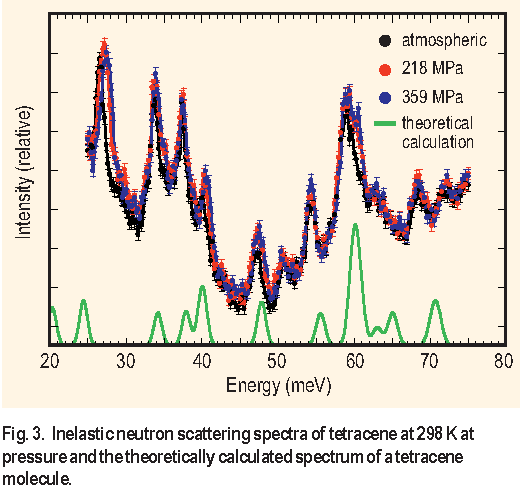
In order to ascertain the role of molecular vibrations on the conduction behavior of tetracene as a function of pressure, inelastic neutron scattering ( I N S ) spectra were collected using the NCNR Filter Analyzer Spectrometer at BT-4. The I N S spectra at ambient, 218 M P a, and 359 M P a pressures are shown in Figure 3. In addition to the experimental data, a theoretical spectrum was constructed from the results of an ab initio density functional theory ( for an individual molecule ) employing the B3LYP functional and 6-31-G* basis set. The spectral peaks in the experimental data at 27, 41, and 47 m e V are affected relatively strongly by the application of pressure ( indicated by their shifts to higher energy ), whereas the peaks at 34 and 59 m e V are moderately shifted and the peaks at 37, 56 and 68 m e V display almost no shift with increasing pressure.
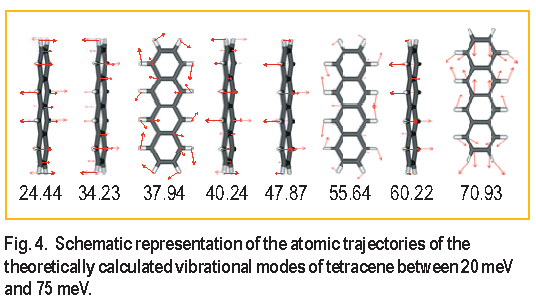
Trajectories defining the atomic displacement of the tetracene molecule for each calculated vibrational mode observed in the experimental data are schematically depicted in Figure 4. The vibrational modes of tetracene can be divided into two types of motions, occurring either within or perpendicular to the ab crystal plane. Comparison of the vibrational trajectories with the peak shifts observed in the I N S data indicates that vibrational modes occurring within the ab crystal plane are affected by the application of pressure and those perpendicular remain unaffected. Because the vibrational modes do not indicate a discrete change in behavior upon transition to the high pressure structural phase, it appears that the phase transition does not affect the dynamic behavior of the molecules within the resolution and pressure range of these experiments.
In summary, we have utilized neutron scattering to investigate the
physical properties of tetracene as a function of pressure. The conduction
mechanism appears to be more strongly dependent on the structural
arrangement of molecules within the crystal lattice, most likely associated
with changes inelectron cloud
overlap, than on the vibrational behavior of the molecules. Further
studies on a series of molecules will indicate whether this observation is
generic to all organic semiconductors or unique to tetracene.
References:
[1] Z. Rang, A. Haraldsson, D. M. Kim, P. P. Ruden, M. I. Nathan, R. J. Chesterfield, and C. D. Frisbie, Appl. Phys. Lett. 79, 2731 (2001).
[2] B. H. Toby, J. Appl. Cryst. 34, 210 (2001).
[3] A. C. Larson and R. B. von Dreele, Los Alamos National Laboratory Report LAUR 86-748 (2000).
[4] R. Jankowiak, H. Bässler, and A. Kutoglu, J. Phys. Chem. 89, 5705 (1985).
A. M. Pivovar and J. B. Leao
NIST Center for Neutron Research
National Institute of Standards and Technology
Gaithersburg, MD 20899-8562
R. J. Chesterfield and C. D. Frisbie
University of Minnesota
Minneapolis, MN 55455-0132