The glassy state of matter is ubiquitous, ranging from ordinary window glass to polymers to proteins. Yet, the nature of the transition between liquid (L) and glassy (G) states remains one of the unsolved problems in the physics of condensed matter. Mode-coupling theory (M C T), originally developed for supercooled simple liquids, makes predictions of liquid-glass (L-G) and glass-glass (G-G) transitions in a colloidal suspension. Here we present small-angle neutron scattering (S A N S) and photon correlation spectroscopy (P C S) measurements confirming these predictions.
In a recent series of papers (Refer to references 1 and 2) M C T predicts that in colloidal systems with a sufficiently short-range effective inter-particle attractive interaction one can observe two types of kinetic glass transitions (K G T). The K G T can be the result of a “cage effect,” originating from the excluded volume effect of the particles at high volume fractions and at high temperatures, or the result of a particle bonding to its nearest neighbors at low k sub B times T, and at all volume fractions.
One particularly interesting feature in this novel state of matter is the occurrence of two distinct amorphous glassy states called respectively the “repulsive glass” (G sub R) and the “attractive glass” (G sub A), as the result of the two distinct mechanisms for the structural arrest mentioned earlier. With P C S and S A N S measurements, we succeeded in detecting both these transitions in L64 / deuterated water micellar system at high volume fractions (Refer to reference 3). L64 is a symmetric tri-block copolymer of composition (P E O) sub 13, (P P O) sub 30, (P E O) sub 13. Above 20 °C, the copolymers self-assemble into spherical micelles each with P P O segments packed into a compact core and P E O segments forming a corona around it. The short-range attraction arises from the overlap of P E O chains in the corona regions when two micelles approach one another. The depth of the attractive well increases with temperature because water becomes an increasingly poor solvent as temperature rises.
If the interaction is modeled by a square-well potential, the crucial control parameters of the phase behavior are: the volume fraction, phi = pi times rho, times d cubed, over six, the effective temperature, T star = k sub B times T over u, and the fractional well-width parameter, epsilon = capital delta over d.. Rho is the number density of the spheres, d its hard core diameter, capital Delta its attractive well-width, and minus u its well-depth.
The calculated glass-transition lines, for the case of epsilon = 0.03 (Refer to reference 2), are shown in Figure 1 in the (T star, phi) plane. On going from higher to lower T star, at volume fractions less than 0.5365 L, G sub A transitions occur, and at volume fractions greater than this value, one has a possibility of observing G sub R, G sub A transitions.
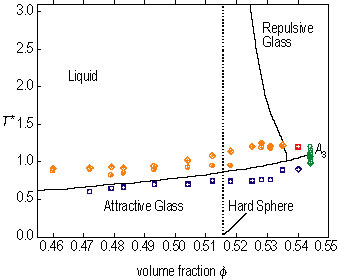
| Figure 1. The lines represent phase boundaries (in T star phi plane) determined by mode-coupling theory for a colloidal system with a short-range attraction (epsilon = 0.03). The phase points shown are for the L64 / deuterated water micellar solution. (Liquid state: orange, glassy states: blue, red, and green.) The results confirm the existence of the attractive branch in the predicted glass-transition boundary, and the G sub A, G sub R transition. |
Figure 2 shows normalized photon correlation functions (coherent intermediate scattering functions, I S F) measured at q approximately equal to 0.001 inverse angstroms and at three different volume fractions, as a function of temperature (Refer to reference 3). For the phi where the L, G sub A transition is possible, one can see that in the L state, the long-time limit of the I S F, f sub q is zero, while in the G sub A state, f sub q super A is approximately equal to 0.4 to 0.5, which is the value of the Debye-Waller factor of the glassy state. The K G T is thus characterized by a discontinuous change of f sub q. At phi = 0.542, we observe the G sub R, (f sub q super r approximately equal to 0.4), to G sub A transition (f sub q super A approximately equal to .7). At phi = 0.544, which is called the A sub 3 singularity end point, our measured I S F’s show identical values of f sub q super r,A, approximately equal to 0.4 in the two glassy states, confirming the theory.
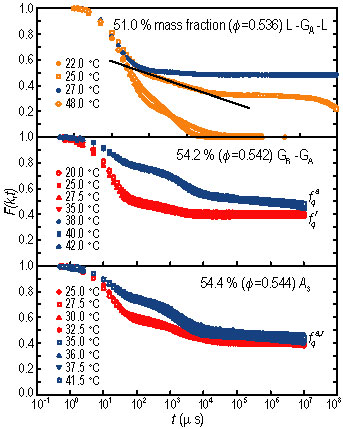
| Figure 2. The I S F as measured by photon correlation spectroscopy at three different volume fractions, phi, at different temperatures. (Data follow the same color scheme as in Figure 1) The top panel shows the re-entrant L, G sub A, L transition. The line highlights a region of logarithmic time dependence preceding the plateau in the liquid state just before the transition (Refer to reference 4). Evidence of the G sub A, G sub R transition can be seen in the middle panel. By comparing the long-time limit of the I S F’s with the predictions of mode-coupling theory (M C T), the two different types of the glasses can be identified by their respective Debye-Waller factors. The bottom panel is for a volume fraction of 0.544, which is the A sub 3 end point predicted by M C T.. f sub q super A, and f sub q super r, become identical, confirming the prediction. |
Figure 3 shows scaling plots of S A N S intensity distributions at four volume fractions, and at different temperatures, spanning the regions of the phase diagram where the L, L G L, G G, and two identical glasses (A, sub 3 point) are located. The scale is set by a unique length parameter, the average inter-particle distance.
Verification of mode-coupling theory predictions through photon-correlation spectroscopy and small-angle neutron scattering measurements on a micellar system provides a basis for improved understanding of the glass transition in general.
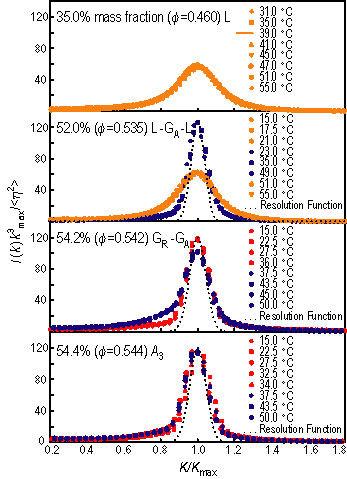
| Figure 3. S A N S scaled intensity distributions versus reduced scattering vector for the micellar solutions at four values of phi, at different temperatures. (Data follow the same color scheme as in Figure 1.) The top panel is for phi = 0.460. All the scaled intensities are characterized by a unique length scale and collapse into a single master curve for all temperatures. The second panel is for phi = 0.535: the system is clearly characterized by two length scales. While the narrower peak is resolution limited, the broader peak is similar to the one observed in the first panel. If we identify the broader peak to represent the liquid state, then the narrower peak should represent the glassy state. The system thus shows a re-entrant L, G, L transition. The third panel is for phi = 0.542. Again, two length scales characterize the system. The narrower peak is resolution-limited and the slightly broader peak is also nearly so. The results can be interpreted as showing a transition between two amorphous solid states, i.e., a G, G transition. The last panel is for phi = 0.544, which is predicted as the A sub 3 point, at temperatures ranging from 15 °C to 50 °C. The two different types of glasses indeed become identical at this volume fraction. |
References
[1] L. Fabbian, W. Götze, F. Sciortino, P. Tartaglia, and F. Thiery, Phys. Rev. E 59, R1347 (1999).
[2] K. Dawson, G. Foffi, M. Fuchs, W. Götze, F. Sciortino, M. Sperl, P. Tartaglia, Th. Voigtmann, and E. Zaccarelli, Phys. Rev. E 63, 011401 (2001).
[3] W. R. Chen, S. H. Chen, and F. Mallamace, Phys. Rev. E 66, 021403 (2002).
[4] F. Mallamace, P. Gambadauro, N. Micali, P. Tartaglia, C. Liao, and S. H. Chen, Phys. Rev. Lett. 84, 5431 (2000).
Authors
S.-H. Chen and W.-R. Chen
Massachusetts of Institute of Technology
Cambridge, MA 02139
F. Mallamace
Massachusetts of Institute of Technology
Cambridge, MA 02139
and
University of Messina
Messina, Italy
Back to FY2002 HTML main page
Go to next article
To view all symbols correctly, please download Internet Explorer 6 or Netscape 7.1