The equivalent of Moore’s law for magnetic recording is that the areal density of magnetically written bits increases at 60 % to 100 % per year, and, of equal interest to the consumer, the cost per megabyte decreases at 40 % to 50 % per year. To achieve this, the noise in the magnetic media must be continuously reduced, which is accomplished by decreasing the size of the magnetic clusters — regions of the media that are magnetically coupled. The cluster size must decrease, since the media noise primarily results from the finite cluster size; the bit transitions are narrower when the clusters are smaller. Presently, cluster sizes are believed to be about 10 nano meters to 15 nano meters, but accurate knowledge of the size distribution and even the average size is lacking. A common assumption is that the cluster size is identical to the crystalline grain size of the media (Refer to reference 1), but this has not been demonstrated.
We have conducted Small Angle Neutron Scattering (S A N S) measurements of the magnetic cluster size in actual recording disks and quantified the size distribution. The measurements were performed at N G 7, 30 meter S A N S instrument with unpolarized neutrons with wavelength of 7 angstroms and a relative wavelength spread of 11 %. Since S A N S is caused by both physical and magnetic inhomogeneities, it is necessary to separate these contributions and to isolate the magnetic cluster S A N S. This was done with two separate measurements. Data were first taken for disks in an initial, high noise state where there are a maximum number of interfaces between magnetic clusters. This is accomplished by first fully magnetizing the disks in a circumferential direction. Then, the disks were scanned with a recording head field in the opposite direction and with a strength approximately equal to the remnant coercivity of the media. This causes approximately half of the magnetic clusters to reverse direction, leaving a maximally noisy state. In this state, the S A N S contains contributions from the physical film structure (grains) and the magnetic film structure (magnetic clusters). Data were then obtained with a magnetic field of 0.6 Tesla applied parallel to the disk surface. This field orients the magnetic moments in the clusters predominantly along the field and, by examining the Q-dependence of the S A N S, we can determine the S A N S from the physical film structure. Subtracting the zero field and 0.6 Tesla spectra leaves the desired magnetic S A N S (Refer to references 2 and 3).
The disks, denoted S o, T o and C y, are those used in three product generations. The magnetic media in each two-sided disk was a cobalt-platinum-chromium alloy (25 nano meters to 40 nano meters thick) sandwiched between a carbon layer and one or more nonmagnetic underlayers. The disks were sliced into eight pieces and stacked to create 16 magnetic layers for the S A N S measurements. The relative signal-to-noise ratio (S sub 0 over N sub m) varied from 0 db, (S o) to 3 db, (T o), to 6.5 db, (C y).
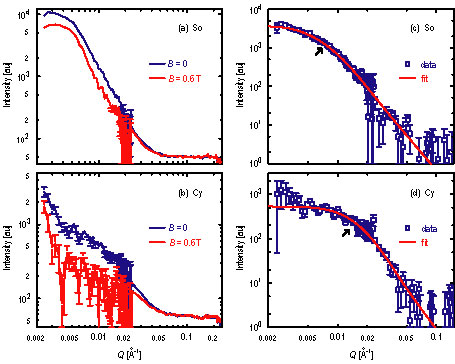
| Figure 1. S A N S intensity for magnetic disks S o and C y, averaged around the incident beam direction which was perpendicular to surface of the disks. In (A) and (B) the blue lines show data for no applied field (high noise state), while red lines show data for a 0.6 Tesla field. Two sample-to-detector distances were used, with Q ranges of 0.0025 inverse angstroms to 0.025 inverse angstroms and 0.025 inverse angstroms to 0.3 inverse angstroms. In (C) and (D) the blue squares are the magnetic S A N S, the difference of the zero and 0.6 Tesla scattering intensities in (A) and (B). The red line shows the best fit to a model described in the text. The arrows mark the approximate Q where the slope of the data changes. |
S A N S data for both magnetic fields are shown in Figures 1 A, and 1 B.. Subtracting these two spectra leaves the desired magnetic S A N S, which are shown in Figures 1 C and 1 D. It is apparent that for increasing S sub 0 over N sub m (S o to C y) there is an increase in the Q where the slope changes, which establishes that the disks with higher S sub 0 over N sub m have smaller average cluster size. In addition, there is a distribution of cluster sizes, since there are no oscillations in the data and the change in slope is gradual.
To determine the cluster size distribution, we have modeled the cluster shapes as cylinders, since T E M shows the physical grains adopt a columnar morphology. The magnetic S A N S data are well fitted using a log-normal distribution of cluster sizes. These distributions are shown in Figure 2, while the fits to the data are shown in Figure 1. Such magnetic cluster size distributions have not been reported before for recording media, and allow us to draw several important conclusions.
First, these results show that the media S sub 0 over N sub m is inversely correlated with the magnetic cluster size. This is apparent from Figure 2 when one recalls that S sub 0 over N sub m increases from S o-T o-C y. This provides firm experimental verification of the models that have proposed smaller clusters give larger S sub O over N sub m (Refer to reference 1). A second conclusion follows from a comparison of the magnetic cluster size to the physical grain size, shown in the inset to Figure 2. The average cluster size is slightly larger than the average grain size, and, for the most advanced media (C y), this difference is < 10 %. This shows that the intergranular magnetic interactions are not very strong, especially for the advanced media; hence, the size of the media noise sources scales with crystalline grain size. This result validates previous (implicit or explicit) assumptions (Refer to reference 1 and 4).
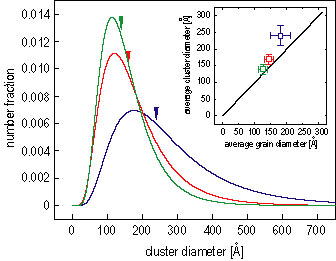
| Figure 2. Green, red and blue curves show the best-fit distributions for disks C y, T o and S o, respectively. The triangles mark the average cluster size. The log-normal r are 0.56, 0.52 and 0.46 for C y, T o and S o, respectively. The inset shows the average magnetic cluster diameter versus the average physical grain diameter, obtained from x-ray diffraction and T E M. |
The cluster size distribution is quite broad with a log-normal r of about 0.5. Recent models of the magnetic recording properties of media have begun to include microstructural disorder (Refer to reference 1), and have shown that the magnetic cluster size distribution has significant effects on these properties. Thus, the exact cluster size distribution is important for these models. Our results provide empirical data on this distribution, which, when incorporated into the models, will improve their reliability.
Our results have implications for magnetic recording technologies. While the lack of coupling is desirable from an S sub O over N sub m perspective, the broad distribution is not, since large clusters will contribute to noise and the small clusters will be thermally unstable. Reducing this distribution will be a major challenge for media designers. Finally, the methodology we have developed will be applicable to future media where the average cluster sizes are less than 10 nano meters.
References
[1] Y. Zhang and H. N. Bertram, IEEE Trans. Magn. 35, 4326 (1999).
[2] J. Suzuki, K. Takei, Y. Maeda, Y. Morii, J. Magn. Magn. Mater. 184, 116, (1998).
[3] J. F. Löffler, H.-B. Braun, W. Wagner, Phys. Rev. Lett., 85, 1990 (2000).
[4] M. F. Doerner, K. Tang, T. Arnoldussen, H. Zeng, M. F. Toney, D. Weller, IEEE Trans. Magn. 36, 43 (2000).
Authors
M. F. Toney and K. Rubin
IBM Almaden Research Center
San Jose, CA 95120
S.-M. Choi
NIST Center for Neutron Research
Present affiliation:
Korea Advanced Institute of Science and Technology
Yuseong-gu, Daejon,
Republic of Korea 305-701
C. J. Glinka
NIST Center for Neutron Research
National Institute of Standards and Technology
Gaithersburg, MD 20899-8562
Back to FY2002 HTML main page
Go to next article
To view all symbols correctly, please download Internet Explorer 6 or Netscape 7.1