Silicon is the foundation material of the electronic age, lying at the base of the 200 billion dollar world wide semiconductor industry. Silicon’s properties are manipulated by precise implantation and distribution of other atoms (dopants), which makes the accurate measurement of impurity distributions imperative. SEMATECH (a consortium of semiconductor manufacturers) recently listed Standard Reference Material (S R M) implant of phosphorus in silicon as a high priority industrial need.
The U.S. semiconductor industry relies heavily on secondary ion mass spectrometry (S I M S) for characterization of the depth distribution of dopants in silicon. To achieve high accuracy in the concentration determination by S I M S, standards of known dopant concentration, conveniently provided by ion implants of certified dose, are required. Standard Reference Materials of boron and arsenic implants in silicon, (S R M 2137 and 2134), (Refer to reference 1), have already been developed by N I S T as S I M S calibration standards.
The S I M S community in the United States undertook a round robin study to calibrate the implanted dose of phosphorus in silicon by consensus. Dose determinations among laboratories varied by nearly a factor of 2, reflecting primarily the errors of the respective in house standards (Refer to figure 1). These results demonstrate the need for a common phosphorus reference material to improve inter-laboratory reproducibility.
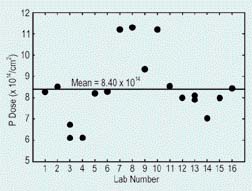 |
Round-robin measurements of phosphorus in silicon by secondary ion mass spectrometry in 16 U.S. industrial laboratories, demonstrating the need for a common phosphorus reference material to improve inter-laboratory reproducibility. |
In pursuit of a phosphorus in silicon S R M, a radiochemical neutron activation analysis (R N A A) procedure has been developed, critically evaluated, and shown to have the necessary sensitivity, chemical specificity, matrix independence, and precision to certify phosphorus at ion implantation levels in silicon, (Refer to references 2 and 3). During sample irradiation, Phosphorous 31 undergoes neutron capture to form Phosphorous 32, which is then separated from the matrix and measured by beta counting. The procedure is used here to assign a value to the quantity of phosphorus in S R M 2133 (phosphorus implanted silicon).
S R M 2133 was prepared by phosphorus implantation of a 200 centimeter diameter silicon wafer. The wafer was cut into 1 centimeter to power 2 pieces by means of a wafer saw, and twelve pieces were chosen for analysis. The area of each piece was determined by measuring its dimensions using a digital micrometer. During irradiation, Phosphorus 32 may be produced via neutron capture by the implanted phosphorus, by bulk phosphorus impurity in the wafer, and by silicon. The latter two sources lead to measurement error, which must be corrected. These corrections were made by measuring silicon blanks, which were prepared by cutting a non-implanted silicon wafer into of order 1 centimeter to power 2 pieces. Standards were prepared by deposition of standardized solutions of phosphorus on aluminum foils.
Samples, standards, and blanks were irradiated for 3 hours in irradiation tube R T 1 of the N I S T neutron source at a neutron fluence rate of 1.05 times 10 to power 14 centimeters to power minus 2 dot s to power minus 1. Targets were then processed using the method developed previously (Refer to references 2 and 3). Silicon samples and blanks were mixed with a few milligrams of non-radioactive phosphorus, (carrier) and dissolved in a mixture of nitric and hydrofluoric acids. Phosphorus was separated from the matrix first by precipitation as ammonium phosphomolybdate, then as magnesium ammonium phosphate. The latter was collected by filtration, washed with dilute ammonium hydroxide and ethanol, air dried, weighed, and packaged for beta-ray counting. The yield, (fraction of recovered phosphorus carrier), was determined gravimetrically, assuming a composition of magnesium nitrogen hydrogen sub 4 oxygen sub 4 dot 6 hydrogen sub 2 oxygen. Standards were processed using a similar procedure.
Counting of phosphorous 32 (halflife equals 14.28 days) was performed using a beta proportional counter. Purity of the phosphorus 32 from other radionuclides was ascertained by gamma ray spectroscopy, and by monitoring beta count rates over a period of four half lives. No discernible contamination from other radionuclides was noted. Phosphorus 32 count rates were adjusted for decay time, blank correction, and for differences in beta self absorption.
N I S T currently certifies elemental concentrations in S R M using one of three modes: (1), a primary method at N I S T with confirmation by other methods; (2), two independent critically evaluated methods at N I S T, and (3), one method at N I S T and different methods by outside collaborating laboratories. Certification using a primary method is only possible when all potentially significant sources of uncertainty have been evaluated explicitly for the application of the method and the matrix under investigation. Therefore, in order to certify the phosphorus concentration in S R M 2133 using R N A A as a primary method it was necessary to evaluate all significant sources of uncertainty explicitly. For this set of measurements, we considered sources of relative uncertainty greater than 0.01 percent to be significant. The results of a complete evaluation of all sources of uncertainty are listed in Table 1. This evaluation yielded an expanded relative uncertainty of 1.27 percent (as defined by I S O and N I S T), and gives an approximate level of confidence of 95 percent. The measured phosphorus concentration is open parenthesis 9.55 plus or minus 0.12 close parenthesis time 10 to power 14 atoms centimeter to the minus two.
In conclusion, we have successfully applied R N A A as a primary method for the certification of this new S R M. The observed relative expanded uncertainty of 1.27 percent is smaller than the 3 percent value needed by the semiconductor industry. This new S R M should greatly enhance the U.S. semiconductor industry’s ability to achieve accurate and reproducible analytical results for this key dopant in silicon.
Table 1
| Source of Uncertainty | Uncertainty (one sigma) percent |
| Measurement Replication (sigma over the square root of n) | 0.31 |
| Measurement Replication (Standards) (sigma over the square root of n) | 0.47 |
| Measurement of Sample Area | 0.012 |
| Blank Correction | 0.022 |
| Blank Correction (Standards) | 0.019 |
| Volumetric Calibrations (Standards) | 0.12 |
| Concentration of Standard Solution | 0.15 |
| Mass Standard Solution on Foil | 0.037 |
| Radiochemical Impurity | 0.13 |
| Beta Self-Absorption | 0.07 |
| Beta Self-Absorption (Standards) | 0.08 |
| Carrier Yield Determination | 0.10 |
| Self-Shielding | 0.024 |
| Irradiation Geometry | 0.09 |
| Combined Uncertainty | 0.63 |
| Coverage Factor | 2.0 |
| Expanded Uncertainty | 1.27 |
References
[1] R. R. Greenberg, R. M. Lindstrom, and D. S. Simons, J. Radioanal. Nucl. Chem, 245, 57 (2000).
[2] R. L. Paul and D. S. Simons, Characterization and Metrology for ULSI Technology, ed. D. G. Seiler, A. C. Diebold, T. J. Shaffner, R. McDonald, W. M. Bullis, P. J. Smith, and E. M. Secula, American Institute of Physics, AIP Conference Proceedings 550, Melville, NY, 2001, pp. 677-681.
[3] R. L. Paul and D. S. Simons, Silicon Front-End Junction Formation Technologies, MRS
Symposium Proceedings 717, ed. D. F. Downey, M. E. Law, A. Claverie, M. J. Rendon, Materials
Research Society, Warrendale, PA, 2002, pp. 291-296.
R. L. Paul and D. S. Simons
Chemical Science and Technology Laboratory
National Institute of Standards and Technology
Gaithersburg, MD 20899-8395
Back to FY2002 HTML main page
Go to next article
To view all symbols correctly, please download Internet Explorer 6 or Netscape 7.1