Water is critical, not only for the correct folding of proteins but also for the maintenance of this folded structure. The internal molecular motions in proteins, which are necessary for biological activity, are very dependent on the degree of flexibility which is determined by the level of hydration. The number of water molecules hydrating a functioning protein is thus an issue of great interest. Given an appropriate model system, neutron scattering, particularly sensitive to hydrogen, provides a way to measure this water content.
Previous optical spectroscopy studies have shown that yeast cytochrome c (Y C C) covalently bound to a soft interface (Figure 1) and partially hydrated by a moist helium atmosphere can be fully functional with respect to the oxidation-reduction chemistry of its iron porphyrin prosthetic group (Refer to references 1, 2, 5 and 6). This system thus provides an opportunity to examine the water distribution required to maintain the structure and function of the protein Y C C.
| Figure 1. Molecular dynamics “snapshot” of Y C C tethered to the soft surface of an uncharged-polar self-assembled monolayer (S A M). |
Unlike x-rays, neutrons scatter very differently from hydrogen and deuterium. This fact allows the water distribution in the monolayer profile structure of Y C C to be obtained by comparison. The neutron scattering length density profile derived from neutron reflectivity for a Y C C monolayer hydrated by deuterated water is compared to the profile for identical hydration with plain water.
The silicon surface layer of an iron-silicon or iron-gold-silicon multilayer solid substrate can bind a self-assembled monolayer (S A M) to form the soft surface used to tether the Y C C monolayer. (See diagrams at the top of Figure 3) Such a multilayer substrate has two key advantages in a neutron (or x-ray) reflectivity experiment: a multilayer substrate dramatically enhances this scattering for momentum transfer normal to the substrate surface, and a multilayer substrate also provides an important reference profile structure for the unique interferometric phasing of the reflectivity data.
Neutron reflectivities (Figure 2) were collected on the N G 1 reflectometer for both plain water and deuterated water hydration cases for two such S A M / Y C C samples. One S A M formed a nonpolar surface (methyl to hydrogen sulfide ratio of 6 to 1, mixed endgroups), and the other S A M formed an uncharged polar surface (hydroxyl to hydrogen sulfide ratio of 6 to 1, mixed endgroups). These data were analyzed using a new interferometric phasing method that makes use of two features: the neutron scattering contrast between the silicon and iron layers in a single reference multilayer structure, and a constrained refinement approach using the finite extent of the gradient of the profile structures for the systems (Refer to reference 3). The water distribution profiles for the two S A M / Y C C monolayers provided by this analysis are shown in Figures 3 A, and 3 B.
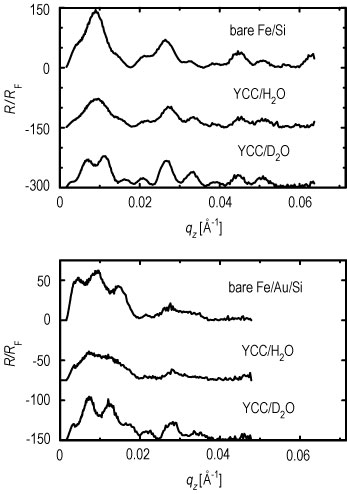
| Figure 2. Top: normalized reflectivity data with incident neutron
spins parallel to the iron magnetization for the bare multilayer
substrate, substrate plus nonpolar S A M plus Y C C over deuterated water,
and substrate plus nonpolar S A M plus Y C C over plain water.
Bottom: data for similar arrangements with the uncharged polar S A M on an iron-gold-silicon substrate. In the top plot the plain water data are offset by 150 units and the deuterated water data by 300 units on the ordinate, and in the bottom plot the plain water data are offset by 75 units and the deuterated water data by 150 units on the ordinate. (Note: q sub z = 2 times sine of theta over lambda) |
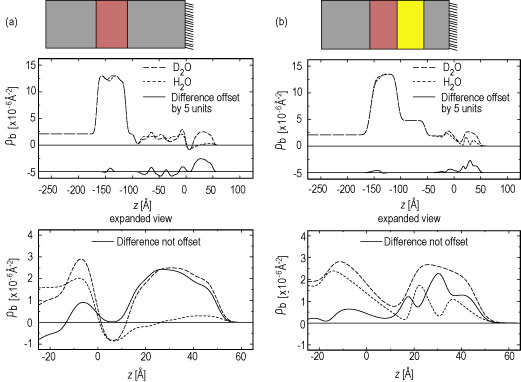
| Figure 3. The absolute neutron scattering length density profiles for partial hydration with deuterated water and plain water and their difference profile for both the nonpolar S A M (A) and the uncharged polar S A M (B) cases. The boundaries for the cytochrome c protein region of the profiles used for calculation of the amount of water hydrating the protein are z = 10 angstroms and z = 60 angstroms. Schematics of the composite structures are shown above their respective scattering length density profiles approximately to scale. |
For hydration with deuterated water, these profiles show that the protein monolayer is 3 angstroms to 4 angstroms closer to the substrate surface for the uncharged-polar S A M compared to the nonpolar S A M. This finding is in excellent agreement with simulations of these systems (Refer to references 3 and 4), and arises because residues on the protein’s surface interact strongly with the polar S A M’s hydroxyl endgroups via hydrogen-bonding, thus drawing the Y C C closer to the S A M surface.
Given these water distribution profiles, the number of water molecules hydrating the Y C C monolayer at each S A M can be calculated. Allowing for proton exchange in the cytochrome c molecule itself (approximately 17 polypeptide backbone hydrogens and approximately 104 side chain hydrogens), we obtained values of approximately 167 water molecules per Y C C at the uncharged polar S A M (exposed to helium at 81 % relative humidity) and approximately 297 water molecules per Y C C at the nonpolar S A M (exposed to helium at 88 % relative humidity) with relative errors of order 20 % to 25 %. These findings allow quantitative comparison to molecular models, opening an important window to understanding the role of water in protein functioning.
References
[1] J. A. Chupa, J. P. McAuley, R. M. Strongin, A. B. Smith, J. K. Blasie, L. J. Peticolas, and J. C. Bean, Biophys. J. 67, 336 (1994).
[2] A. M. Edwards, J. K. Blasie, and J. C. Bean, Biophys. J. 67,1346 (1998).
[3] L. R. Kneller, A. M. Edwards, C. E. Nordgren, J. K. Blasie, N. F. Berk, S. Krueger, and C. F. Majkrzak. Biophys. J. 80, 2248 (2001).
[4] C. E. Nordgren, D. J. Tobias, M. L. Klein, and J. K. Blasie. Biophys. J., in press.
[5] J. M. Pachence, S. M. Amador, G. Maniara, J. Vanderkooi, P. L. Dutton, and J.K. Blasie. Biophys. J. 58, 379 (1990).
[6] J. M. Pachence, and J. K. Blasie. Biophys. J. 59, 894 (1991).
Authors
L. R. Kneller, N. F. Berk, S. Krueger, and C. F. Majkrzak
NIST Center for Neutron Research
National Institute of Standards and Technology
Gaithersburg, MD 20899-8562
J. K. Blasie, A. M. Edwards, and C. E. Nordgren
Department of Chemistry
University of Pennsylvania
Philadelphia, PA 19104
Back to FY2002 HTML main page
Go to next article
To view all symbols correctly, please download Internet Explorer 6 or Netscape 7.1