Wetting plays an important role in diverse applications ranging from insecticide sprays to detergency. This interest, in part, has motivated a great deal of fundamental research involving the spreading (wetting) of a liquid on a solid surface. Polymer blends are of great commercial importance and therefore their thermodynamic and phase separation behaviors have been widely studied.
The structure and properties of thin blend films are governed by the interplay between phase separation and surface segregation driven by polymer-surface interactions. The nature of the segregation depends on whether the mixture forms a stable one-phase fluid or phase-separates (Refer to references 1 and 2). In the former case, the surface-enrichment-layer (S E L) grows and stabilizes to an equilibrium value. In the latter case the initially formed S E L breaks into droplets for partial wetting and grows unsteadily for complete wetting (Refer to reference 1). The late stage evolution of the surface enrichment layers thus exhibits “non-universal” growth laws, depending on the phase stability, wetting characteristics of the blend, confinement, as well as on the details of the polymer-surface interaction potential (Refer to reference 2). The universality of surface segregation at the early-stage, however, has not been explored, partly because the compositional changes are normally rapid (Refer to references 3 and 4). We therefore designed a measurement that can access the short time and small length-scale surface-enrichment regime.
A critical blend film near the glass transition of the polymers is utilized so that the chain dynamics are greatly slowed down even under thermodynamically strong segregation conditions. The polymers are deuterated poly (methyl methacrylate) (d P M M A) and poly (styrene-ran-acrylonitrile) (S A N). This polymer blend has a lower critical solution temperature (L C S T) below T sub g as revealed by small-angle neutron scattering measurements. A 445 angstrom film of d P M M A / S A N (fifty/fifty by mass) was obtained by spin-casting from a common solution. After drying at a temperature slightly below T sub g, the films were annealed in a vacuum oven at (130 ± 0.1) °C, for various times ranging from 1 minute to 36 hours. After drying and after each step of annealing, the film was measured using neutron reflectivity (N R). An atomic force microscopy study indicated that the film roughness was below 6 angstroms throughout the measurement.
Figure 1 shows N R spectra after several annealing intervals. The spectra were analyzed using a model-fitting scheme. The best fits are shown as the solid curves, and their corresponding compositional profiles are shown in Figure 2. The inset of Figure 2 shows the evolution of the d P M M A volume fraction in the depletion zone (phi sub d) and at the surface (phi sub s). The former decreases monotonically, suggesting that equilibrium has not been achieved, while the non-monotonic variation of the latter is due to the surface relaxation at the initial time.
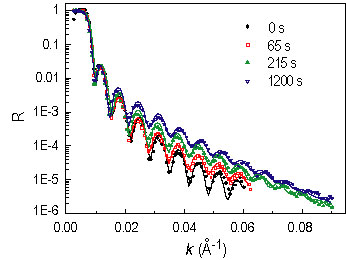
| Figure 1. Selected neutron reflectivity spectra after various times at 130 °C. |
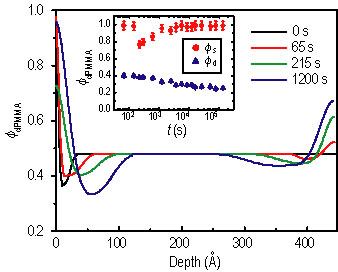
| Figure 2. Phi sub d P M M A profiles that give the best fit. The inset shows the evolution of surface composition, phi sub s (circles) and depletion layer composition, phi sub d (triangles). |
The surface excess, z star = the integral over x of the quantity, open bracket, phi of x, minus phi sub d, close bracket, is shown in Figure 3, and can be fit to a power law t to the 0.41 ± 0.01, for early times (solid line), and a stretched exponential form for the entire time (dashed curve). The latter gives z star of infinity equal to 72 angstroms at the saturation. z star starts to deviate from the power-law behavior at about 9 h (indicated by the arrow in Figure 3) corresponding to z star = 40 angstroms and xi sub s = 57 angstroms, where xi sub s is the surface correlation length characterizing the decay of the surface enrichment composition. These crossover scales in the kinetics are comparable to the bulk correlation length xi sub b is approximately equal to 60 angstroms, suggesting a transient saturation. After that, the S E L will grow unsteadily, entering the later stage of the wetting layer growth (Refer to reference 4).
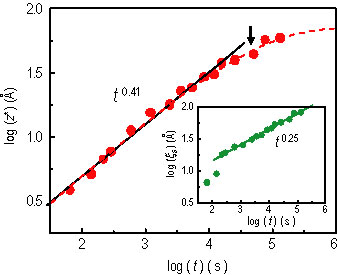
| Figure 3. z star with a power-law fit (solid line), t to the power 0.41, and a stretched exponential function (dashed curve). The arrow denotes a z star approximately equal to 40 angstroms and the transition to slower growth. The inset shows the surface correlation length. |
The inset of Figure 3 shows that xi sub s nearly follows a power law of t to the 0.25 ± 0.01, except for initial times. Note that right after drying, z star of (0) = 4 angstroms, indicating a segmental scale of saturation from processing the film (spin-casting and drying). Thus, the initial “anomaly” of phi sub s and xi sub s may reflect the relaxation of the highly non-equilibrium compositional profiles. While most of the previous work focused on the kinetics after the formation of the initial layer on the order of the correlation length, the transient early-stage of the S E L has received little attention. The interpretation of the apparent power law growth will thus require further investigation.
In summary, during the early stage of surface segregation, enrichment at a monomer length-scale occurs first, followed by a segregation layer that grows to the order of the bulk correlation length, xi sub b, which coincides with the radius of gyration of polymers deep in the two-phase regime. Thus, the two observed distinct surface saturation states correspond to the characteristic scales of macromolecules. However, at near criticality, previous studies suggest a large discrepancy between xi sub s and xi sub b, pointing to the need to consider three length scales: that of the monomer, the molecular size, and the size of compositional fluctuations. The extent of universality in the early stage growth kinetics therefore needs further investigation. The present study is the first to quantitatively examine this important phenomenon.
References
[1] S. Dietrich, in Phase Transitions and Critical Phenomena, ed. by C. Domb and J. L. Lebowitz, Academic Press, London (1988) Vol. 12.
[2] K. Binder, J. Non-Equilib. Thermodyn. 23, 1 (1998), and references therein.
[3] S. Puri and K. Binder, J. Stat. Phys., 77, 145 (1994); S. Puri and K. Binder, Phys. Rev. E, 49, 5359 (1994).
[4] H. Wang, and R. J. Composto, Phys. Rev. E, 61, 1659 (2000).
Authors
H. Wang, J. F. Douglas and C. C. Han
Polymers Division
National Institute of Standards and Technology
Gaithersburg, Maryland 20899-8542
S. K. Satija
NIST Center for Neutron Research
National Institute of Standards and Technology
Gaithersburg, Maryland 20899-8562
Back to FY2002 HTML main page
Go to next article
To view all symbols correctly, please download Internet Explorer 6 or Netscape 7.1