3D chemical imaging at the nanoscale
John Henry J. Scott, NIST Microanalysis Research Group
In the last 30 years, analytical electron microscopy (AEM) has advanced
steadily via innovative electron optics, better spectroscopic detectors,
improved computer control, and multi-modal data acquisition technology.
The AEM analyst now has access to a wealth of high-quality,
multidimensional data about the sample. As a result, the current
challenge is to devise schemes to manage and exploit this flood of raw
data and to synthesize the results into meaningful solutions to
real-world problems. Recently, researchers have begun to explore
the possibility of chemical tomography in the AEM, the determination
of 3D elemental distributions in the sample based on tilt-series of
energy-filtered TEM (EFTEM) elemental maps and high-angle annular
dark field (HAADF) STEM structural data. One of the chief barriers
to this work is that for thicker samples EFTEM maps can show
non-monotonic relationships between the observed signal in the
2D tilt images and the concentration of the analyte in the pixel.
This violates the projection requirement, a key assumption in
many 3D reconstruction algorithms. Because of this, most successful
work to date has been limited to systems that (at least approximately)
satisfy the projection requirement and do not exhibit the full
complexity of interactions possible in the AEM. To get past this
hurdle, it is necessary to construct new models for 3D reconstruction
in the AEM that are not based on x-ray tomography predecessors and
that explicitly account for effects such as beam spreading,
multiple scattering, and through-sample self-absorption. The
study of simulated ("phantom") data
like the sinogram in the figure
is an important step towards constructing accurate 3D
reconstructions from AEM datasets.
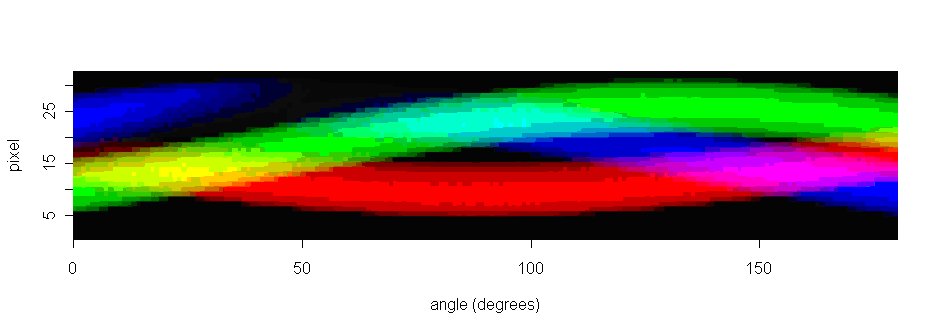 "Chemical sinogram" from an AEM tilt series of three cylinders (Cu,
Al, and SiO2); each cylinder is 600 nm in diameter.
The colored lines display XEDS x-ray intensities vs. sample tilt
angle (horizontal axis) and position on the sample (vertical axis).
Red is Cu Kα, green is O Kα, and blue is Al Kα.
"Chemical sinogram" from an AEM tilt series of three cylinders (Cu,
Al, and SiO2); each cylinder is 600 nm in diameter.
The colored lines display XEDS x-ray intensities vs. sample tilt
angle (horizontal axis) and position on the sample (vertical axis).
Red is Cu Kα, green is O Kα, and blue is Al Kα.
Back to Seminar Home Page
Last modified 02-August-2007 by website owner: NCNR (attn: )