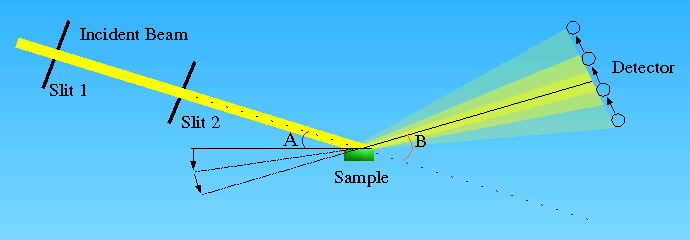
A reflectometer consists of an incident beam, slits to control beam width and beam divergence, attenuators to control flux, the sample mount, and one or more detectors. You can control the slits, the attenuators, the incident angle of the beam and the reflected angle to the detector. The slits are typically chosen such that the sample is fully illuminated throughout the entire range of angles. At very low angles the slits are fixed slightly open otherwise the beam intensity would go to zero.
|
| ||
|
|
|
After reducing the reflectometry data, you are left with a reflectivity curve giving the proportion of reflected beam as a function of Q in reciprocal space. In practice, you will want to be able to see both Q and angle theta throughout the reduction process.
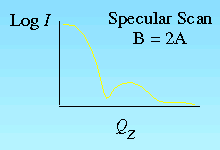
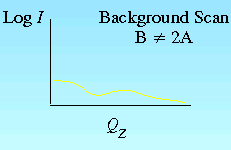
There are four scans that are used to compute the final reflectivity, as determined by the incident and reflected angles. Keeping the reflected angle equal to the incident angle measures the specular reflection. Keeping the reflected angle slightly above or below the incident angle measures the off-specular reflection. Under the assumption of a perfectly flat sample, the off-specular reflection is considered to be background noise, and is to be subtracted from the specular reflection when producing the final reflectivity curve. The positive offset and a negative offset background scans are averaged before subtracting them from the specular scan. Keeping the incident and reflected angles at zero but gradually opening the slits measures the slit scan. This records the power of the incident beam which you need in order to normalize the final reflectivity curve.
One instrument, NG7, has a monitor at the final slit of the incident beam which together with the slit width can be used to normalize the data immediately without a separate slit scan.
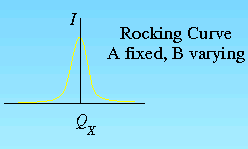
There is also the rocking curve. Here the incident angle is fixed and the reflected angle is varied. If the peak does not occur when the reflected angle matches the incident angle, then you know that the sample is not mounted properly. The rocking curve will also give an indication of the validity of the assumption that the sample surface is perfectly flat. Using a position-sensitive detector rather than a pencil detector, you can measure an entire rocking curve without scanning the detector. At present this is used to estimate the specular and background signals simultaneously so it makes more efficient use of the instrument. A topic of research is how to extract information about the surface of samples which are not uniform from the grid of rocking curves taken at various incident angles.
There are a variety of other measurements that are made, such as fixing slits and angles but varying temperature or field (or occasionally on NG7, the height of the sample). Our software can display these curves, but they do not enter into further reduction or analysis.